Both Clinically Significant Change (CSC) and the Severity-Adjusted Effect Size (SAES) describe client progress in OpenFIT, but they measure different aspects of change. Understanding how they relate helps clinicians interpret outcome data in both individual and aggregated reports.
Clinically Significant Change (CSC)
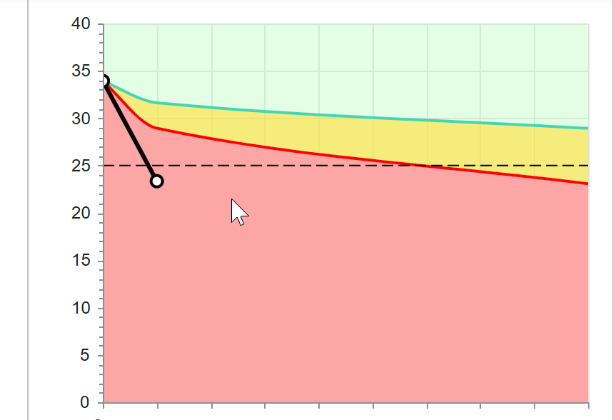
CSC refers to crossing the clinical cut-off line. A client shows clinically significant change when their score starts below the cut-off (in the red zone) and ends above it (in the green zone). It answers the question: Did the client move from the clinical to the non-clinical range?
CSC identifies meaningful improvement but does not indicate how large that change is in standardized terms or whether the change was better or worse than expected compared to clients who started with similar levels of distress.
Severity-Adjusted Effect Size (SAES)
The Severity-Adjusted Effect Size (SAES) is a statistical measure of the magnitude of change, expressed in standard-deviation units. It shows how far a client’s actual outcome differs from the Expected Treatment Response (ETR)—the modelled recovery curve for clients who began at the same level of distress.
Formula
SAES = (Actual Score − Expected Score) ÷ Standard Deviation
OpenFIT uses the alternative severity-adjusted method from Seidel, Miller & Chow (2013), with an additional normalization step so that SAES = 0 represents performance equal to the large reference dataset.
- Positive values → client outcomes are better than expected.
- Negative values → client outcomes are below the expected recovery trajectory.
Effect Size Categories (“Buckets”)
In the Effect Size Report, OpenFIT groups individual SAES values into standard-deviation categories to show the distribution of outcomes:
| Category | Range (SD) | Interpretation |
|---|---|---|
| Significantly Improved | ≥ 0.8 | Well above expected change |
| Somewhat Improved | 0.5 to < 0.8 | Better than expected |
| No Change | −0.5 to < 0.5 | Within normal variation |
| Somewhat Worse | −0.8 to < −0.5 | Below expected change |
| Significantly Worse | ≤ −0.8 | Well below expected change |
These categories allow clinicians and teams to see, at a glance, what proportion of clients achieved greater-than-expected progress, remained stable, or deteriorated relative to the expected model.
Summary
- Clinically Significant Change (CSC): Did the client cross the clinical threshold into the non-clinical (green) zone?
- Severity-Adjusted Effect Size (SAES): How far above or below the expected recovery curve did the client finish, in standard-deviation terms?
For a more technical explanation of Effect Size based on the Seidel, J. A., Miller, S. D., & Chow, D. L. (2013). Effect size calculations for the clinician: Methods and comparability paper go here.
Was this article helpful?
That’s Great!
Thank you for your feedback
Sorry! We couldn't be helpful
Thank you for your feedback
Feedback sent
We appreciate your effort and will try to fix the article